
How To Use
This page provides instructions for using ResearchRandomizer, a software tool rigorously tested by statisticians with both academic and industry expertise. The platform enables researchers to easily, systematically, and ethically randomize samples into optimized treatment groups based on covariate values.
ResearchRandomizer was originally developed to support my own preclinical immunology research on glioblastoma. In these studies, my colleagues and I worked with mice, implanting brain tumors (except in control groups), randomizing the mice into treatment groups, and delivering therapies aimed at reducing or eliminating the tumors. Ensuring minimal variation in covariates—such as tumor size, animal weight, and other health indicators—is critical to avoid skewing results. At the same time, true randomization of treatment groups is essential for ethical and methodological integrity.
This software addresses these challenges by combining covariate analysis techniques, stratified randomization strategies, and user input to generate treatment groups that are both balanced and randomized. It performs these tasks instantaneously through an intuitive, user-friendly online interface. Given the fast-paced nature of lab work, I prioritized simplicity to save researchers valuable time. Importantly, ResearchRandomizer is entirely free. There are no subscriptions or hidden fees. Research is already expensive, and I believe that tools essential for scientific discovery should be universally accessible. Science should not be a privilege. Since its launch in August 2024, the platform has been widely adopted by research labs across the globe, finding applications in diverse fields such as psychology, economics, and physics, beyond its origins in immunology. Although I am the sole creator, the platform has been shaped by invaluable feedback from its users, making it feel like a collaborative effort. It has been incredibly rewarding to develop this tool, and I hope you find it helpful. As the software continues to evolve, please don’t hesitate to reach out with any questions or suggestions.
Text/Call: (919) 407 - 0653
Email: TylerMHerrick@gmail.com
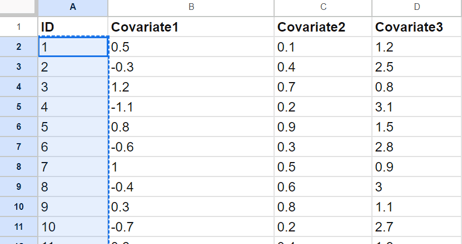
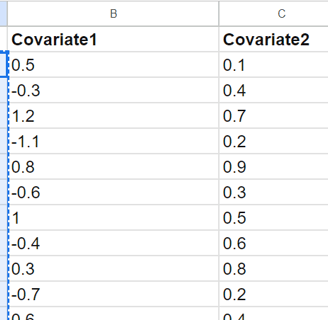
Copy Data Directly from a Spreadsheet
->
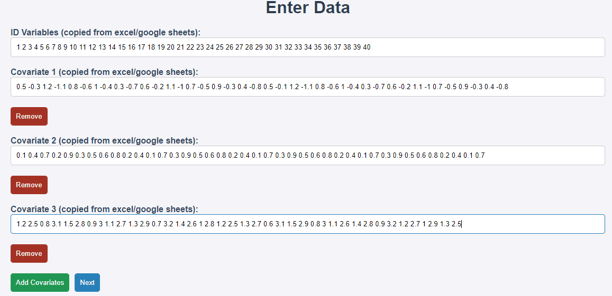
Copying each column separately allows you to choose which covariates you want to include in the randomization. Each box in the randomizer will then have a list of values separated by spaces.
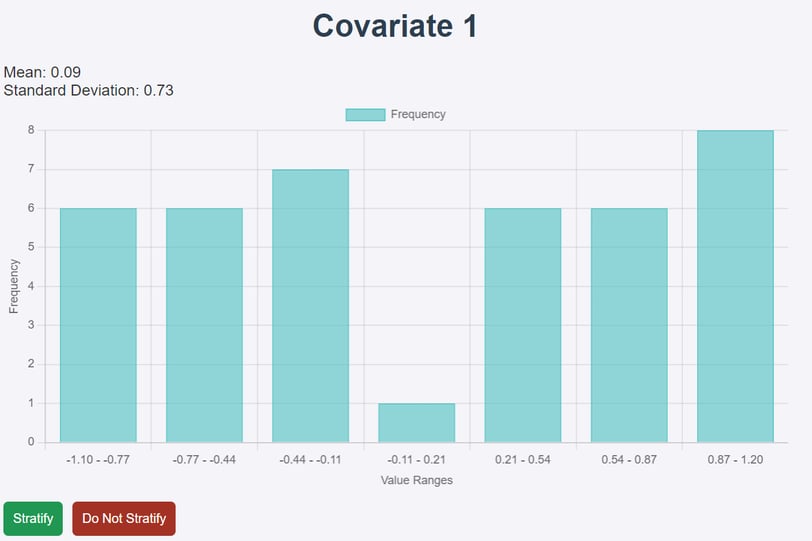
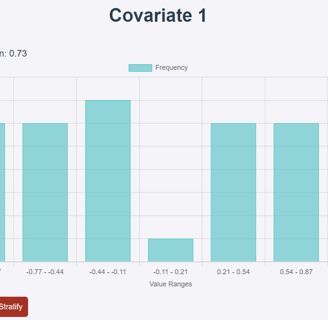
Analyze Your Data
This page shows a histogram and important values for your first covariate. If this histogram adheres closely to a normal distribution, then you don't have to stratify it in the randomization process, so you would click "Do Not Stratify." If the data doesn't adhere to a normal distribution (like this example data) then click on "Stratify." Repeat this process for each covariate
Choose Your Number of Treatment Groups
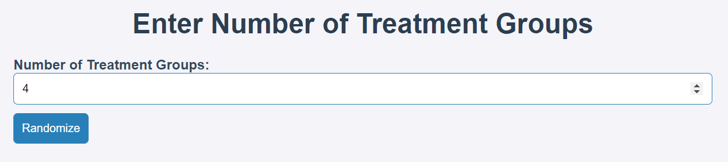
Choose the number of treatment groups you want to randomize your samples into
View and Balance the Randomized Results
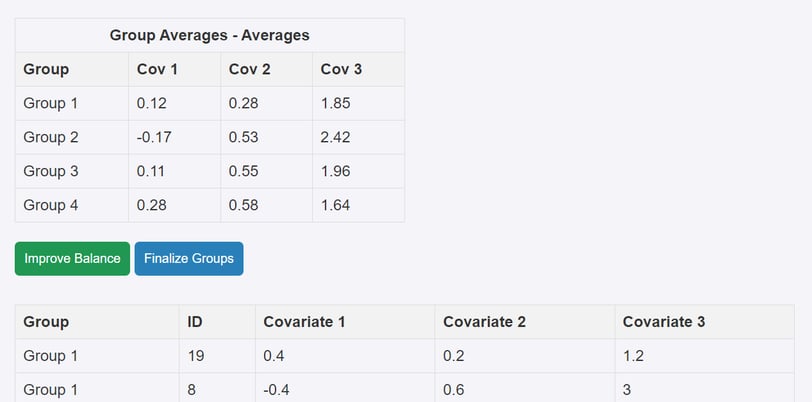
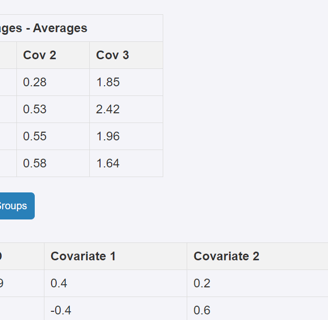
The first table is the mean of each covariate in each group. The second table is the actual group assignments found using stratified covariate randomization.
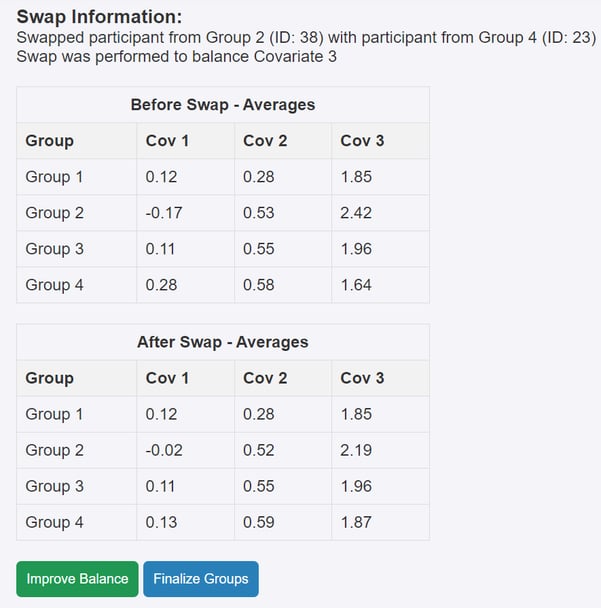
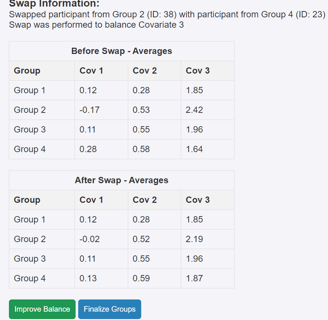
Analyze the first table and find any imbalances in the covariates. In this example data, in Covariate 3, Group 2's mean is substantially higher than the others. To fix this, click the "Improve Balance" button, select Covariate 3, and then the website will run an optimization algorithm. This algorithm will swap 2 samples between their groups to balance the selected covariate while still maintaining the majority of the randomized data.
Be very intentional about this balancing process though, because the more times you balance, the less "random" your group assignments become.
Finalize the Randomized Results
Once you are happy with the balanced data, Click "Finalize Groups." This will show you a table of the final grouping assignments. View this table, then, at the bottom of the page, click the "Copy Table To Clipboard" button, and paste your results back into your spreadsheet.
ResearchRandomizer
Streamlined randomization for researchers and scientists.
Explore
TylerMHerrick@gmail.com
(919) 407-0653
© 2025. All rights reserved.